How to Setup a Windows Malware Lab with Splunk Enterprise, Docker Compose, Ubuntu Server and Proxmox
2025-12-11
Introduction
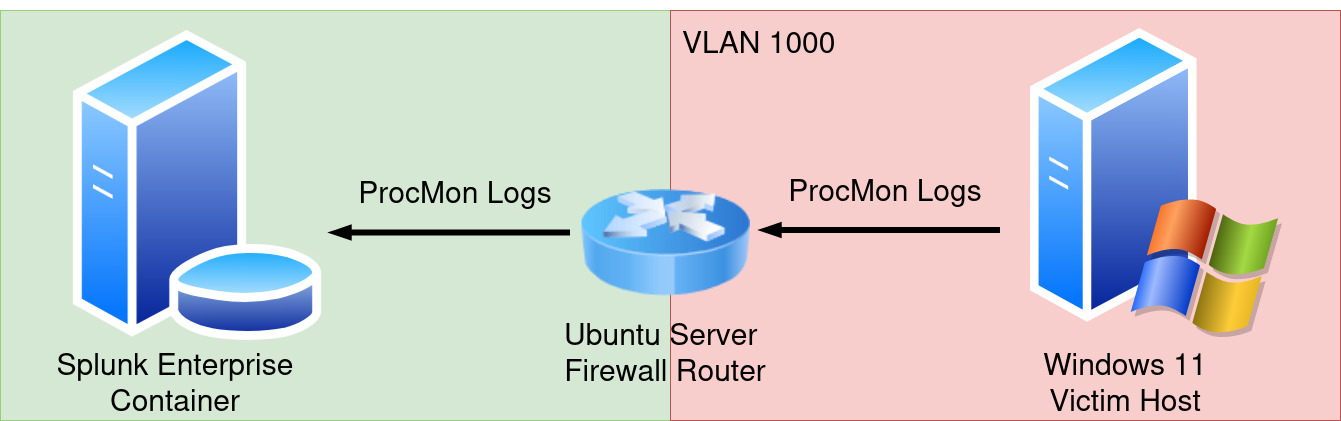
In this article, I will describe how to setup a Windows malware lab in Proxmox using Splunk Enterprise, Docker Compose, and Ubuntu Server. The lab will be made up of a Splunk Enterprise Docker container, a victim Windows 11 host in an isolated VLAN network, and an Ubuntu Server configured as a firewall router to facilitate communication between the two. The victim Windows 11 host will execute malware samples within the isolated VLAN network and record process events via Process Monitor (or “ProcMon”). The Process Monitor logs will then be sent to the Splunk Enterprise server for analysis.
The final product will look like this:
Once the lab is set up, I’ll walk through some key security considerations to keep in mind when working with malware samples. Then I’ll wrap things up with a quick demo on how to use the lab to safely run malware and observe its behavior.
You will need a Proxmox server to follow along with this article. If you haven’t set one up yet and would like guidance, I highly recommend The Homelab Alamanac. I also won’t be covering how to install operating systems on new virtual machines. If you’re not yet comfortable creating virtual machines in Proxmox, take a moment to learn the basics first, then return to this article when you’re ready.
Requirements
- Proxmox server
- Experience creating containers and virtual machines
- Understanding of basic TCP/IP networking
Outline
- Introduction
- Lab setup
- Security considerations
- Demonstration
Lab Setup
Before we begin setting up the lab, it’s important to review some foundational networking concepts in Proxmox. When Proxmox is first installed, it automatically creates a default Linux bridge interface called vmbr0. From pve.proxmox.com:
A Linux bridge interface (commonly called vmbrX) is needed to connect guests to the underlying physical network. It can be thought of as a virtual switch which the guests and physical interfaces are connected to.
According to this documentation, we can think of the vmbr0 bridge as a virtual switch that all of our virtual machines are connected to. By default, this bridge does not understand VLAN tagging. To enable proper VLAN tagging, we simply need to make the bridge “VLAN aware”.
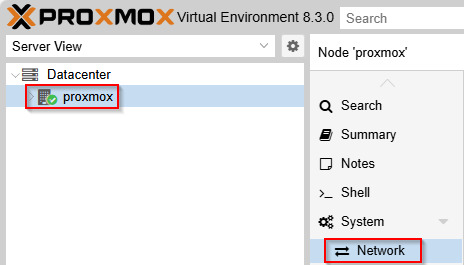
In the Proxmox web GUI, select Your Node > Network:
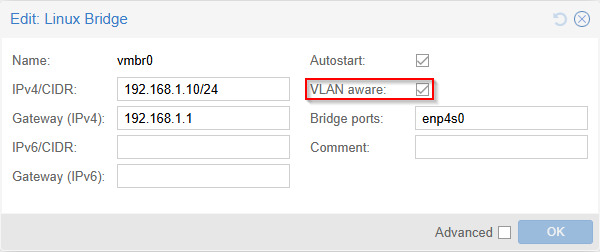
Double-click the default Linux Bridge vmbr0. In the new window that appears, check the box that says “VLAN aware” and click “OK”:
Be sure to save your changes by selecting “Apply Configuration” near the top:
![[Pasted image 20251201233135.png]]
Splunk Enterprise Server
The Splunk Enterprise server will act as the core of our lab, serving as the central place where we ingest and analyze all our log data. Perhaps the easiest way to spin up a Splunk Enterprise server is by using Docker Compose.
To follow along, you will need to create a virtual machine on your Proxmox server with Docker Compose installed. For this purpose, I created a new Ubuntu Server virtual machine on my Proxmox server and gave it a static IPv4 address of 192.168.1.160.
Once your virtual machine is created, and Docker Compose installed, create a new Docker Compose file named compose.yaml with the following content:
name: "siem"
services:
  splunk:
    image: ${SPLUNK_IMAGE:-splunk/splunk:latest}
    container_name: splunk
    environment:
      - SPLUNK_START_ARGS=--accept-license
      - SPLUNK_GENERAL_TERMS=--accept-sgt-current-at-splunk-com
      - SPLUNK_PASSWORD=${SPLUNK_PASSWORD}
    ports:
      - 8000:8000
      - 9997:9997
In the same directory, create a new file named .env with the following contents:
SPLUNK_PASSWORD=CHANGEME
- Replace
CHANGEMEwith your desired password.
The .env file will store the password to access our Splunk Enterprise instance via the web GUI interface.
Start the container:
docker compose up -d
In a web browser, navigate to http://<IP address>:8000, replacing <IP address> with the IP address of the host running the Splunk Enterprise container. You should be greeted with a login page:
![[Pasted image 20251121154909.png]]
- Login with the username
adminand the password you configured.
Once logged in, you should see a dashboard like this: ![[Pasted image 20251121160432.png]]
At this point the Splunk instance is up and running, but we still need to configure it to receive incoming logs.
Navigate to Settings > Forwarding and Receiving: ![[Pasted image 20251121160715.png]]
On this page, there is a section titled Receive Data:
![[Pasted image 20251121160807.png]]
Click the + Add new button. Enter your desired port number:
![[Pasted image 20251121160848.png]]
- The port number entered here must be the same number specified in the Docker Compose file under the
portssection.
Click Save. With the Splunk instance now configured to receive log events, we can move on to setting up the victim host.
Victim Host
For the victim host, I setup a new Windows 11 virtual machine on my Proxmox server. For now, I connect it to the default bridge vmbr0 with no VLAN tag:
![[Pasted image 20251207201404.png]]
- I will add a VLAN tag later to isolate the host.
Once the Windows 11 host is up and running, we need to take care of two important tasks:
- Log process events on the victim host
- Forward those event logs to the Splunk Enterprise server
To capture process events, we’ll use Process Monitor. Then we’ll use Splunk Universal Forwarder to send those log events from the victim host to the Splunk Enterprise server.
Splunk Universal Forwarder Setup
Install the Splunk Universal Forwarder onto the victim host.
Download the Splunk Universal Forwarder here: ![[Pasted image 20251123213720.png]]
(Optional): The download page requires you to sign up. If you don’t wish to sign up, use the following PowerShell script to retrieve a list of the binaries so you can download them directly:
# Fetch the HTML
$response = Invoke-WebRequest "https://www.splunk.com/en_us/download/universal-forwarder.html"

# Extract all occurrences of data-link="..."
$matches = [regex]::Matches($response.Content, 'data-link="([^"]+)"')

# Output the captured URLs
$matches.Value -replace 'data-link="', ''
Once you’ve downloaded the binary, execute it and continue.
Use all the default options when installing. Be sure to check the box at the top to accept the License Agreement: ![[Pasted image 20251123214523.png]]
- Click “Next”.
For the username, I chose admin and entered a password:
![[Pasted image 20251128195259.png]]
On the next screen, don’t enter anything, just click “Next”: ![[Pasted image 20251123214924.png]]
On the next screen, enter the hostname or IP address of the Splunk Enterprise instance: ![[Pasted image 20251123215016.png]]
- In my case, the IP and port to my Splunk Enterprise instance is
192.168.1.160:9997.
Click “Next”. Finally, click “Install”: ![[Pasted image 20251123215109.png]]
Now the Splunk Universal Forwarder should be installed at C:\Program Files\SplunkUniversalForwarder.
At this point, we’ve successfully installed the Splunk Universal Forwarder. Now we need to create a directory to store our logs, and then tell the Splunk Universal Forwarder to monitor the directory.
Open a PowerShell command prompt as Administrator and execute the following command:
mkdir C:\Logs; mkdir C:\Logs\PML; mkdir C:\Logs\CSV; mkdir C:\Logs\Temp
This will create the following directory hierarchy:
C:\LOGS
├───CSV
├───Temp
└───PML
Process Monitor doesn’t support capturing and exporting events to CSV in a single step. Instead, it requires a two-phase workflow: first, you record activity and save it as a Process Monitor Log (PML) file. Then, you run Process Monitor again to convert that PML file into a CSV. The Temp directory temporarily holds the CSV file while it’s being generated, after which the completed file is moved to the CSV directory. This will prevent The Splunk Universal Forwarder from trying to read the file before it’s completed.
To finish up, we just need to tell the Splunk Universal Forwarder to monitor the C:\Logs\CSV directory:
cd C:\Program Files\SplunkUniversalForwarder\bin\

.\splunk.exe add monitor C:\Logs\CSV\*.csv
Process Monitor Setup
Login to the victim Windows host and start a new PowerShell session as an Administrator.
Execute the following command to download the Procmon ZIP archive:
wget https://download.sysinternals.com/files/ProcessMonitor.zip -Outfile C:\ProcessMonitor.zip
Extract the archive:
Expand-Archive C:\ProcessMonitor.zip -DestinationPath C:\ProcessMonitor
There should now be a directory C:\ProcessMonitor\ which contains the following files:
Eula.txt
Procmon.exe
Procmon64.exe
Procmon64a.exe
(insert showing how to create the proper configuration file for saving events)
In Process Monitor > Options > Select Columns > Check everything you want to record > OK
Then File> Export Configuration > Save as C:\ProcessMonitor\ProcmonConfiguration.pmc
(insert showing how to create the proper filter thingy)
// I need to confirm here if Process Monitor just “remembers” the event you saved from using the GUI.
// 1. Specify Filter File: Add /Filter followed by the path to your .PMF filter file, e.g., Procmon.exe /Filter C:\MyFilters.pmf /SaveApplyFilter /SaveAs C:\output.csv.
//
// Process Monitor: Filtering Part 2
//
//
Next, I need a way to run Process Monitor automatically in 60-second intervals after system boot, and save each capture file with a timestamped filename. To accomplish this, I’ll create a PowerShell script that does the following:
- Executes Proccess Monitor to record events for 60 seconds
- Save the event file to the
C:\Logs\PMLdirectory using a timestamp in the filename - Execute Process Monitor again to convert the PML file to a CSV file and save it to
C:\Logs\CSV
Create a new PowerShell script file at C:\ProcessMonitor\script.ps1 with the following contents:
# Timestamp for filenames
$Timestamp = Get-Date -Format "yyyyMMdd_HHmmss"

# Start Procmon
Start-Process -FilePath "C:\ProcessMonitor\Procmon64.exe" -ArgumentList "/AcceptEula", "/Minimized", "/Quiet", "/LoadConfig C:\ProcessMonitor\ProcmonConfiguration.pmc","/BackingFile C:\Logs\PML\$Timestamp.PML", "/Runtime 60" -Wait

# Kill any running Procmon processes
Start-Process -FilePath "C:\ProcessMonitor\Procmon64.exe" -ArgumentList "/Terminate" -Wait

# Convert the saved PML file to CSV
Start-Process -FilePath "C:\ProcessMonitor\Procmon64.exe" -ArgumentList "/AcceptEula", "/Minimized", "/Quiet", "/OpenLog C:\Logs\PML\$Timestamp.PML", "/SaveApplyFilter", "/SaveAs C:\Logs\Temp\$Timestamp.csv" -Wait

# Move the CSV file to the monitored directory
Move-Item -Path "C:\Logs\Temp\$Timestamp.csv" -Destination "C:\Logs\CSV\$Timestamp.csv"

exit 0
- If you’re using a 32-bit system, replace
Procmon64.exewithProcmon.exe.
The script above will perform the following tasks:
- Set timestamp variable for use in filenames
- Execute Procmon for 60 seconds, saving log files to
C:\Logs\PML\. - Cleanly kill any currently executing
Procmon64.exeprocesses. - Convert the saved PML file to CSV and save to
C:\Logs\CSV\.
For the scheduled task, I wanted it to execute every 60 seconds indefinitely, at system boot. I couldn’t find a way to do this in one command from the command line, so I created the scheduled task on my host, and exported it as XML.
Save the following XML in a file named Task.xml on your victim host:
<?xml version="1.0" encoding="UTF-16"?>
<Task version="1.2" xmlns="http://schemas.microsoft.com/windows/2004/02/mit/task">
  <RegistrationInfo>
    <Date>2025-11-23T16:58:18.6684885</Date>
    <Author>DESKTOP-LJDKCAD\john</Author>
    <URI>\Procmon</URI>
  </RegistrationInfo>
  <Triggers>
    <BootTrigger>
      <Repetition>
        <Interval>PT1M</Interval>
        <StopAtDurationEnd>false</StopAtDurationEnd>
      </Repetition>
      <Enabled>true</Enabled>
    </BootTrigger>
  </Triggers>
  <Principals>
    <Principal id="Author">
      <UserId>S-1-5-18</UserId>
      <RunLevel>HighestAvailable</RunLevel>
    </Principal>
  </Principals>
  <Settings>
    <MultipleInstancesPolicy>Parallel</MultipleInstancesPolicy>
    <DisallowStartIfOnBatteries>false</DisallowStartIfOnBatteries>
    <StopIfGoingOnBatteries>false</StopIfGoingOnBatteries>
    <AllowHardTerminate>true</AllowHardTerminate>
    <StartWhenAvailable>false</StartWhenAvailable>
    <RunOnlyIfNetworkAvailable>false</RunOnlyIfNetworkAvailable>
    <IdleSettings>
      <StopOnIdleEnd>true</StopOnIdleEnd>
      <RestartOnIdle>false</RestartOnIdle>
    </IdleSettings>
    <AllowStartOnDemand>false</AllowStartOnDemand>
    <Enabled>true</Enabled>
    <Hidden>true</Hidden>
    <RunOnlyIfIdle>false</RunOnlyIfIdle>
    <WakeToRun>false</WakeToRun>
    <ExecutionTimeLimit>PT5M</ExecutionTimeLimit>
    <Priority>7</Priority>
  </Settings>
  <Actions Context="Author">
    <Exec>
      <Command>C:\Windows\System32\WindowsPowerShell\v1.0\powershell.exe</Command>
      <Arguments>-ep bypass C:\ProcessMonitor\script.ps1</Arguments>
    </Exec>
  </Actions>
</Task>
Next, create the following PowerShell script called task.ps1:
$XmlFilePath = "C:\Path\To\Your\Task.xml"
$TaskName = "Procmon"
$XmlContent = Get-Content -Path $XmlFilePath | Out-String

Register-ScheduledTask -Xml $XmlContent -TaskName $TaskName
Execute the script:
powershell -ep bypass .\task.ps1
You should now have a task registered as Procmon. Confirm via the following command:
Get-ScheduledTask -TaskName "Procmon"
Finally, restart the victim host to start the task. Once logged in, wait a minute or two, and you should start seeing new log files being populated under C:\Logs\CSV.
Wait another few minutes, and you should start seeing some events populate in your Splunk Enterprise instance.
You can check by entering the following SPL query:
index=main
If you do not see logs populating in your Splunk index, you can check the splunkd log files on the victim host at:
C:\Program Files\SplunkUniversalForwarder\var\log\splunk\splunkd.log
Shut down the host for now, as the log file directory will very quickly take up space.
Once it’s shut down, change the interface to be on VLAN 1000.
Ubuntu Server Firewall Router
Now it’s time to set up the Ubuntu Server firewall router. This router will serve as the messenger between the isolated VLAN network and the Splunk Enterprise server. It will have two network interfaces: one interface connected to the same network as the Splunk Enterprise instance, and another interface connected to the VLAN network in which the victim Windows 11 host will reside. I will use iptables to forward log traffic from the victim Windows 11 host to the Splunk Enterprise server. All other traffic from the isolated VLAN network will be dropped.
To get started, download the official Ubuntu Server ISO from ubuntu.com and use it to create a new virtual machine on your Proxmox server (but don’t power on the virtual machine yet). I recommend to dedicate at least 2 CPU cores and 4GB of RAM to this virtual machine. Once the virtual machine is created, be sure it remains powered off.
In the Proxmox web GUI menu, select your virtual machine > Hardware > Add > Network Device: ![[Pasted image 20251202124055.png]]
In the new window that appears, enter a VLAN tag of “1000”: ![[Pasted image 20251202131009.png]]
Click “Add”. Traffic on this interface will now be tagged with VLAN 1000. I’ll apply the same configuration when setting up the Windows 11 host so both systems can communicate with each other.
You should now see two network interfaces attached to the virtual machine: ![[Pasted image 20251203120144.png]]
Be sure the network interface you just created says tag=1000 on the end to indicate it’s apart of VLAN 1000:
![[Pasted image 20251203120309.png]]
Now you can power on the new Ubuntu Server virtual machine. Follow all the default settings when creating the virtual machine.
(( maybe here i can insert a sped up GIF of me creating the virtual machine ))
Set your desired hostname, username and password. ![[Pasted image 20251203120803.png]]
Also check the box to install OpenSSH server: ![[Pasted image 20251203120837.png]]
Reboot to complete the installation.
Once rebooted, sign in via SSH and update and upgrade all the packages:
sudo apt update
sudo apt upgrade
Now it’s time to configure the server to be a router. To do this I need to enable IP forwarding.
Edit /etc/sysctl.conf:
sudo vi /etc/sysctl.conf
Uncomment or add the following line:
net.ipv4.ip_forward=1
INSERT PART ABOUT DISABLING IPv6 TOO
Save and close. Apply the changes:
sudo sysctl -p /etc/sysctl.conf
Now it’s time to configure the network interfaces. To list all interfaces:
ip a
My output:
1: lo: <LOOPBACK,UP,LOWER_UP> mtu 65536 qdisc noqueue state UNKNOWN group default qlen 1000
    link/loopback 00:00:00:00:00:00 brd 00:00:00:00:00:00
    inet 127.0.0.1/8 scope host lo
       valid_lft forever preferred_lft forever
    inet6 ::1/128 scope host noprefixroute
       valid_lft forever preferred_lft forever
2: ens18: <BROADCAST,MULTICAST,UP,LOWER_UP> mtu 1500 qdisc pfifo_fast state UP group default qlen 1000
    link/ether bc:24:11:fd:2c:d7 brd ff:ff:ff:ff:ff:ff
    altname enp0s18
    inet 192.168.1.197/24 metric 100 brd 192.168.1.255 scope global dynamic ens18
       valid_lft 6662sec preferred_lft 6662sec
    inet6 fe80::be24:11ff:fefd:2cd7/64 scope link
       valid_lft forever preferred_lft forever
3: ens19: <BROADCAST,MULTICAST> mtu 1500 qdisc noop state DOWN group default qlen 1000
    link/ether bc:24:11:29:51:5d brd ff:ff:ff:ff:ff:ff
    altname enp0s19
Your output might be slightly different, but it’s ok.
Currently I have two network interfaces:
ens18with MAC addressbc:24:11:fd:2c:d7ens19with MAC addressbc:24:11:29:51:5d
Looking at the network interfaces in the Proxmox web GUI for our virtual machine, we can see that they match up: ![[Pasted image 20251203122414.png]]
In my case, ens18 is connected directly to my home LAN. Its IP address was configured via my home router’s DHCP service.
I want to configure both network interfaces to have a static IP address. Networking configuration in Ubuntu is handled via Netplan.
To configure my network interfaces, i create a new file /etc/netplan/99_config.yaml:
sudo vi /etc/netplan/99_config.yaml
network:
  version: 2
  renderer: networkd
  ethernets:
    ens18:
      addresses:
        - 192.168.1.150/24
      routes:
        - to: default
          via: 192.168.1.1
      nameservers:
          addresses: [192.168.1.1]

    ens19:
      addresses:
        - 10.0.0.1/24
sudo netplan apply
FINALLY IT WORKS
I want traffic flowing into interface ens19 on port 9997 to be forwarded to interface ens18
# Flush any existing rules
iptables -F

# Drop all packets that don't match a rule
iptables -P INPUT DROP
iptables -P FORWARD DROP
iptables -P OUTPUT DROP

# Allow traffic on loopback interface
iptables -A INPUT -i lo -j ACCEPT
iptables -A OUTPUT -o lo -j ACCEPT

# Allow established and related connections
iptables -A INPUT -m conntrack --ctstate ESTABLISHED,RELATED -j ACCEPT
iptables -A OUTPUT -m conntrack --ctstate ESTABLISHED -j ACCEPT

# Allow SSH
iptables -A INPUT -p tcp --dport 22 -j ACCEPT

# Allow new connections from private to public interface on 9997/tcp
iptables -A FORWARD -i ens19 -o ens18 -p tcp --syn --dport 9997 -m conntrack --ctstate NEW -j ACCEPT
iptables -A FORWARD -i ens19 -o ens18 -m conntrack --ctstate ESTABLISHED,RELATED -j ACCEPT
iptables -A FORWARD -i ens18 -o ens19 -m conntrack --ctstate ESTABLISHED -j ACCEPT

iptables -t nat -A POSTROUTING -o ens18 -p tcp --dport 9997 -d 192.168.1.160 -j MASQUERADE
Security Considerations
At this point we have achieved our goal of setting up a Windows 11 host that records process events via Process Monitor and forwards them to our Splunk Enterprise server via the Splunk Universal Forwarder. Before executing any malware on the victim host, it’s very important that we take a moment to think about some security considerations.
If you’re hosting this lab in your local network (like me), you obviously don’t want malware to be able to reach other parts of your network. In fact, the only other host the victim host should be able to reach is the Splunk Enterprise server.
For this reason, I have created a new subnet
References
-
[Automated Detection with Sigma The Taggart Institute](https://taggartinstitute.org/p/detection-with-sigma)
Useful SPL Queries
index=main NOT "Image Path" IN ("C:\\ProcessMonitor\\Procmon64.exe", "C:\\Program Files\\SplunkUniversalForwarder\\bin\\splunk-powershell.exe", "C:\\Program Files\\SplunkUniversalForwarder\\bin\\splunkd.exe")